
As part of our national accreditation process we are required to report 8 measures of program effectiveness publicly. We are proud of our success and we invite you to compare these data with other accredited programs.
Impact on P-12 learning and development
Based on a sample of School of Education graduates, teachers in their first or second year of teaching completed a unit of instruction and used a matched pre-assessment and post-assessment to measure the percentage learning gain of their students. Teachers enter pretest and posttest scores on a preformatted Excel spreadsheet. In addition, they add demographic data on each student, including gender, ethnicity, and identified learning needs. Last, candidates add the total possible points of the assessment to the spreadsheet. The spreadsheet is returned to the SOED for analysis.
| Graduation Year | 2016 12 teachers |
2017 11 teachers |
2018 6 teachers |
2019 1 teachers |
2020 7 teachers |
| P-12 student count | 188 | 187 | 95 | 21 | 233 |
| P-12 student average gain | 31.27 | 25.08 | 35.04 | 32.34 | 43.84 |
Indicators of teaching effectiveness
As part of a case study methodology, School of Education faculty visit early career teachers' classrooms and conduct an abbreviated observation similar to the observation completed during student teaching. In this case, data are recorded and analyzed qualitatively. Clicking the link below will show both the format of the observation and data summaries.
Early Career Teacher Classroom Observation
Results of employer surveys, including retention and employment milestones
An educational research firm was hired by a consortium of Schools of Education to develop and administer a survey of employer satisfaction with newly hired teachers from Schools of Education in the State of Oregon. Although numbers have been improving, the response rates may indicate that responses are not representative of all employers who have selected University of Portland graduates as new teachers. The survey instrument was designed to address Interstate Teacher Assessment and Support Consortium (InTASC) performance categories. In the table below the numbers represent the percentage of responses within each response category.
| InTASC Category | Completely unprepared | 2 | 3 | 4 | 5 | 6 | 7 | 8 | 9 | Very well prepared | |
| Learner and learning | 1.0 | 4.1 | 7.5 | 9.2 | 11.7 | 25.8 | 29.2 | 6.7 | 5.0 | ||
| Content knowledge | 1.5 | 4.6 | 10.8 | 6.2 | 10.8 | 21.5 | 32.3 | 9.2 | 3.1 | ||
| Instructional practice | 2.6 | 7.7 | 14.1 | 12.8 | 32.1 | 19.2 | 7.7 | 3.8 | |||
| Professional responsibilities | 5.8 | 3.3 | 10.8 | 10.0 | 19.2 | 30.0 | 15.8 | 4.2 | |||
Results of completer surveys
An educational research firm was hired by a consortium of Schools of Education to develop and administer a survey of new teacher satisfaction with the preparation they received from Schools of Education. Although numbers have been improving, the response rates may indicate that responses are not representative of all University of Portland graduates who have become new teachers. The survey instrument was designed to address Interstate Teacher Assessment and Support Consortium (InTASC) performance categories. In the table below the numbers represent the percentage of responses within each response category.
| InTASC Category | Completely unprepared | 2 | 3 | 4 | 5 | 6 | 7 | 8 | 9 | Very well prepared | Don't know |
| Learner and learning | 2.3 | 11.6 | 4.7 | 9.3 | 2.3 | ||||||
| Content knowledge | 2.4 | 2.4 | 2.4 | 9.5 | 11.9 | 2.4 | 2.0 | ||||
| Instructional practice | 2.4 | 2.4 | 4.8 | 9.5 | 4.8 | 7.1 | 3.3 | ||||
| Professional responsibilities | 2.4 | 2.4 | 2.4 | 9.5 | 7.1 | 7.1 | 1.0 | ||||
Graduation Rates
| Program | Cohort Year | Percent Graduating |
| Undergraduate | 2015 | 98 |
| MAT | 2015 | 100 |
| Undergraduate | 2016 | 86 |
| MAT | 2016 | 99 |
| Undergraduate | 2017 | 88 |
| MAT | 2017 | 100 |
| Undergraduate | 2018 | 86 |
| MAT | 2018 | 89 |
| Undergraduate | 2019 | 96 |
| MAT | 2019 | 100 |
| Undergraduate | 2020 | 97 |
| MAT | 2020 | 95 |
In all Advanced Programs 100% of candidates graduate in year credits are completed.
Ability of completers to meet licensing (certification) and any additional state requirements
For our licensure programs all candidates must meet all licensing requirements prior to graduation. This means that all completers of our programs are recommended for licensure in the State of Oregon.
Ability of completers to be hired in education positions for which they were prepared
The majority of out-of-state teaching positions for our graduates are in Washington State, but our graduates teach in schools all over the world, which has made tracking of graduates out of state exciting but difficult—hence the range of unknown graduates. The table below shows the percentage of graduates within each employment category for each of the most recent graduating cohorts.
| Teaching | |||||||
| Cohort size (n) | In state | Out of state | Total teaching | Higher education | Non-education/ unemployed | Unknown | |
| 2015 | 99 | 37.4 | 26.3 | 77.8 | 4.0 | 19.2 | |
| 2016 | 93 | 46.2 | 22.6 | 73.1 | 6.5 | 20.4 | |
| 2017 | 90 | 32.9 | 38.4 | 71.2 | 2.8 | 10.9 | 15.1 |
| 2018 | 100 | 15.1 | 15.1 | 30.2 | 9.3 | 17.5 | 41.9 |
| 2019 | 77 | 59.0 | 31.1 | 90.2 | 3.3 | 1.6 | 4.9 |
| 2020 | 69 | 49.3 | 31.9 | 81.2 | 8.7 | 5.8 | 4.3 |
Student Loan Default Rates
The U.S. Department of Education provides a searchable database on institutional student loan default rates. The posted data represent listings from late September each year and the new numbers shown in the chart below are posted in January of the following year.
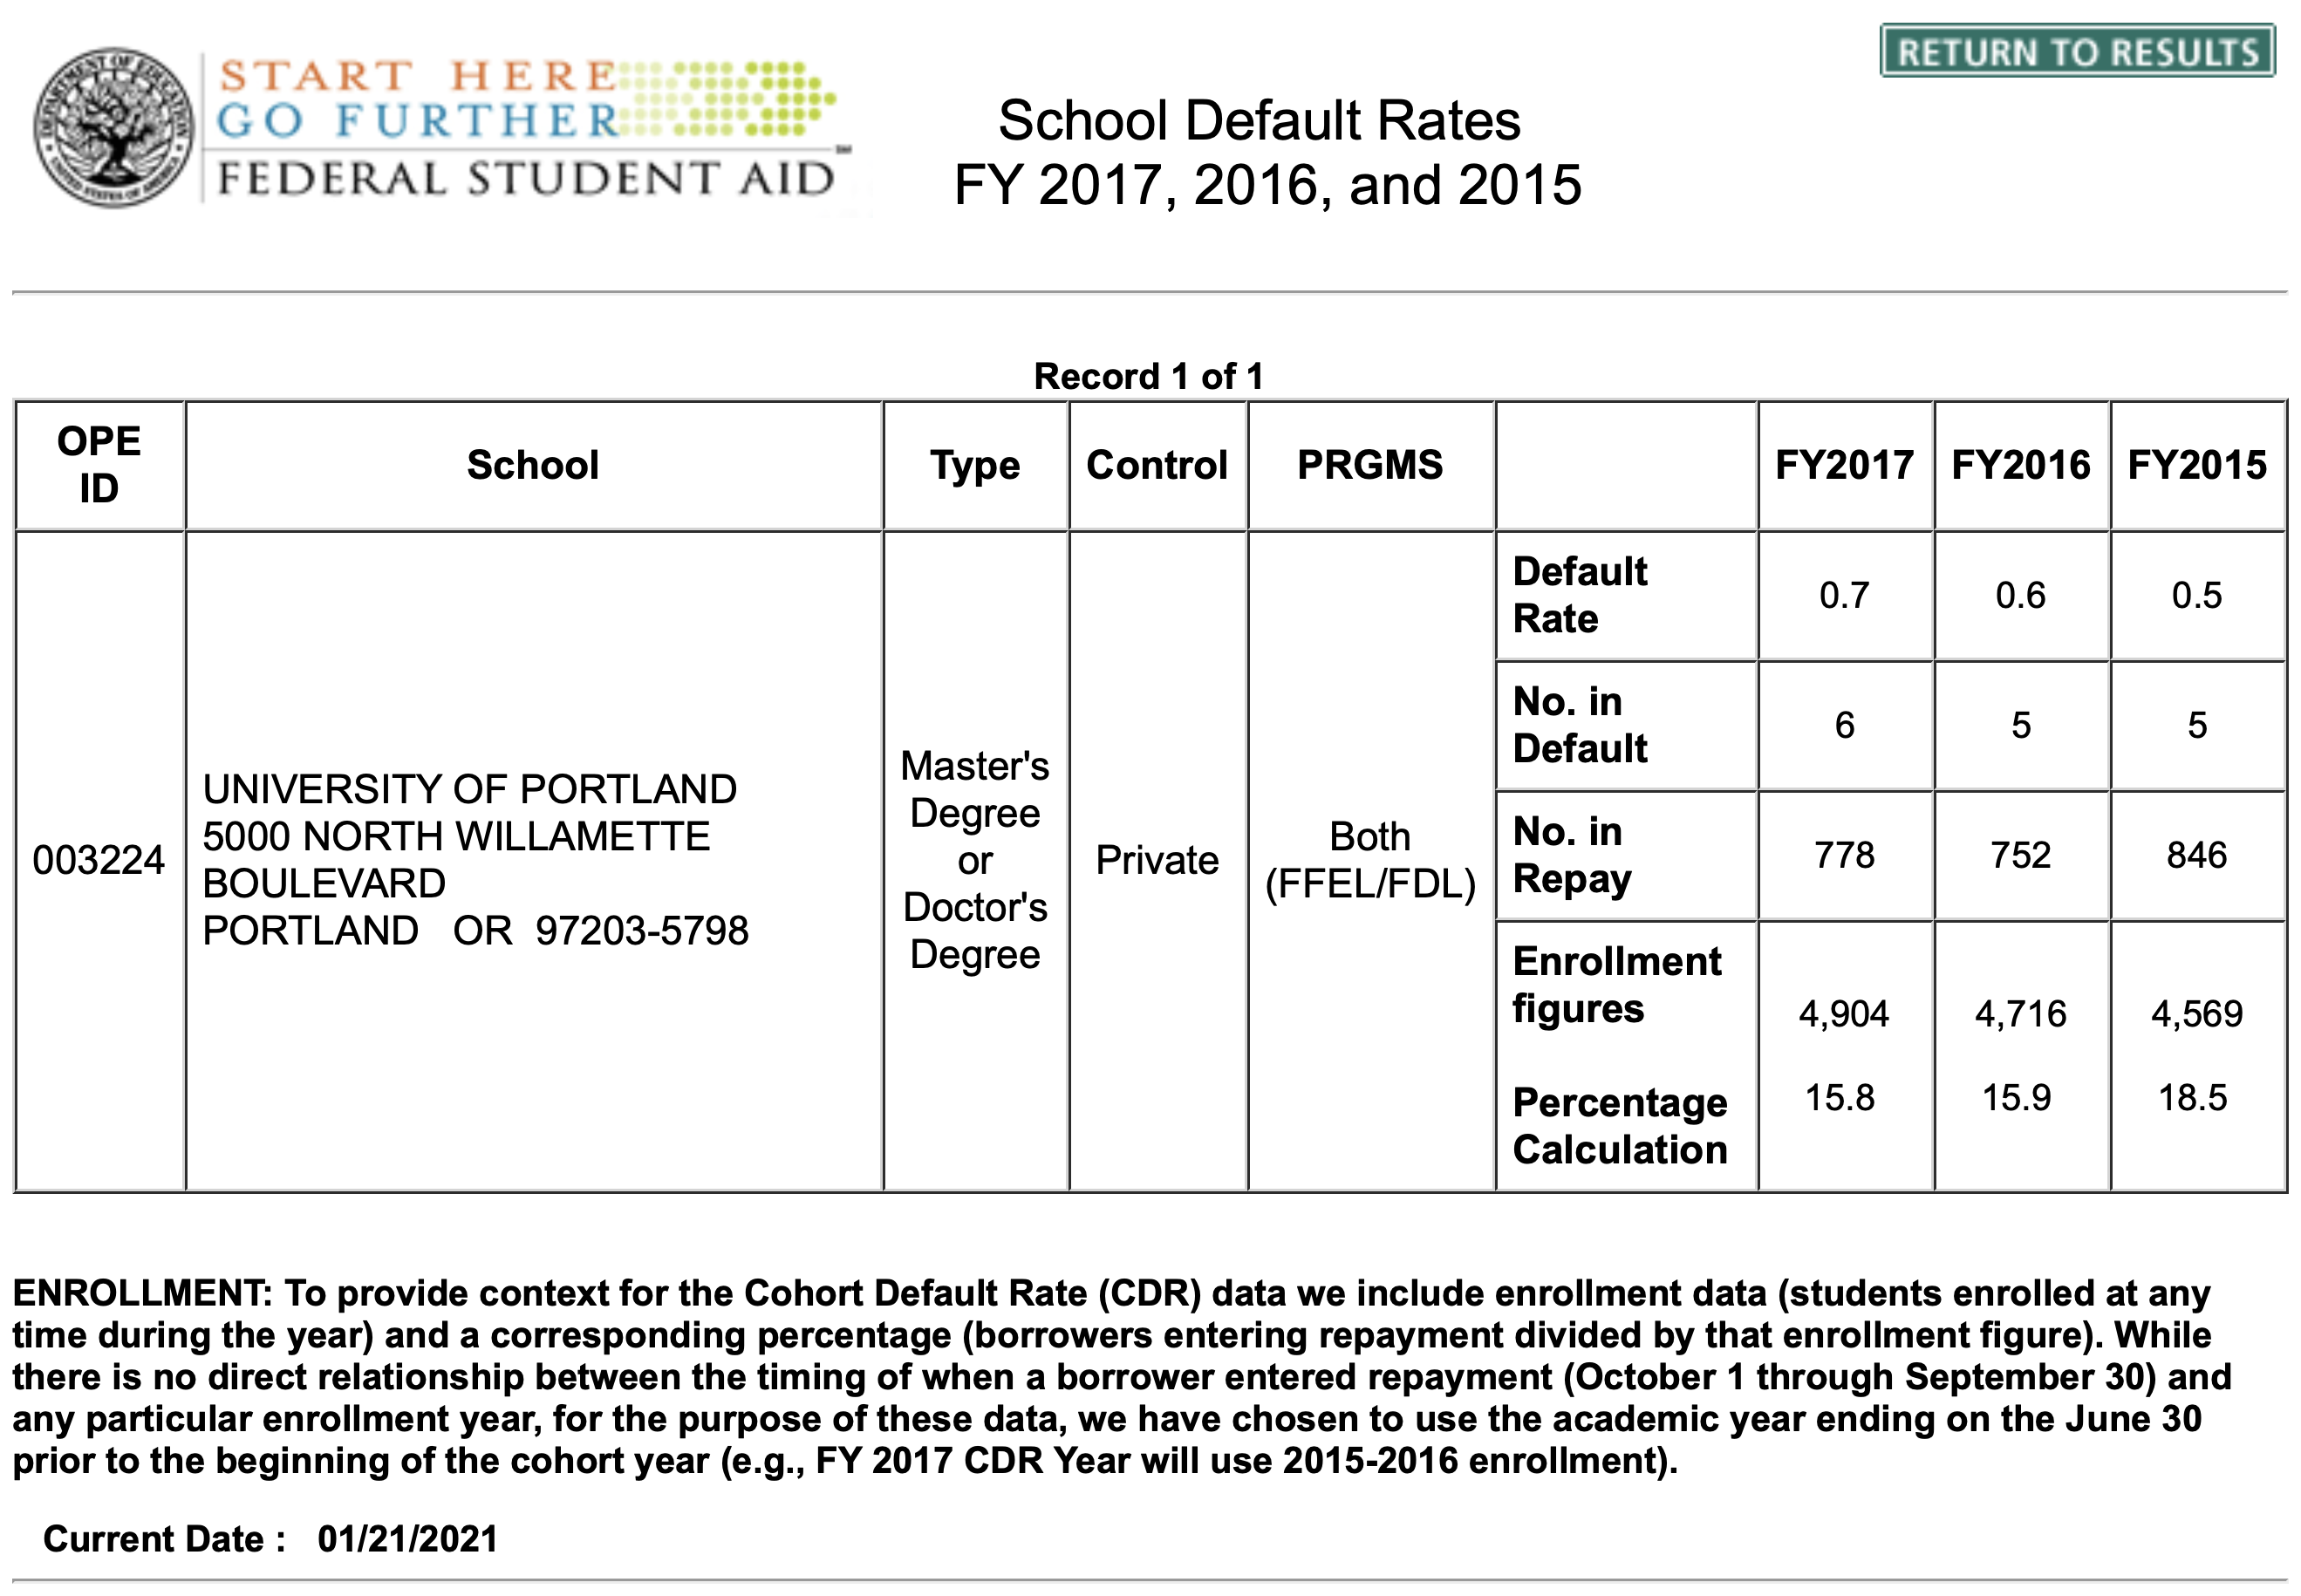
University of Portland default rates are perennially low compared to almost any other institution. If you wish to look up the rates for other institutions follow the link below.
U.S. Department of Education Office of Federal Student Aid